

Table of contents
In this project, we are going to see how we can configure New Relic to monitor a website for this availability.
There are several features/functionalities that New Relic provides. For this use case, we are going to utilize "Synthetic Monitoring".
Step1:- Creating a Synthetic Monitoring
From the New Relic home page, select Synthetic Monitoring from the left side panel.
Click on Create your first monitor and select monitor type as Availability. In the next tab, it will ask you to Configure Monitor", and provide the below information as per your choice.

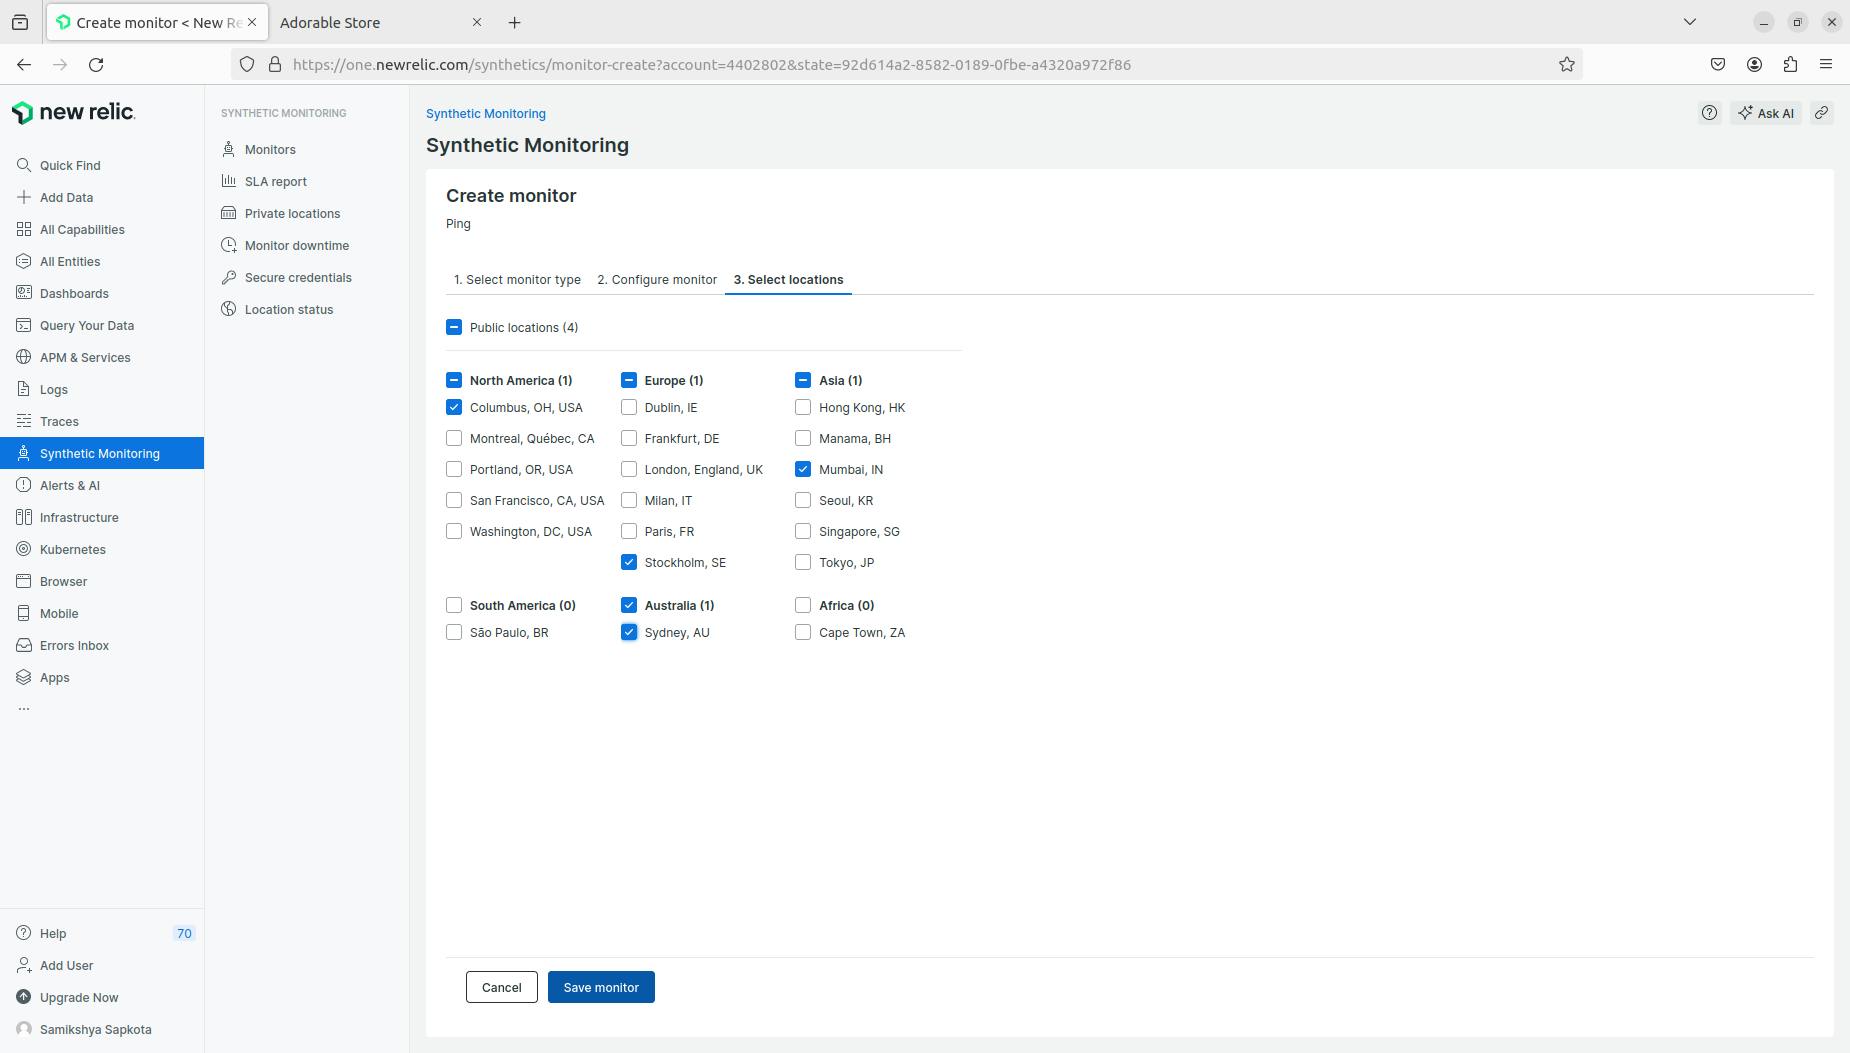
In the next tab Select location, select at least 3 locations from where New Relic will try to ping the website. You might ask why at least 3 locations - there can be chances that the website might have some issues in one location so to avoid false positives, it is recommended.
After selecting locations, click on Save Monitor.
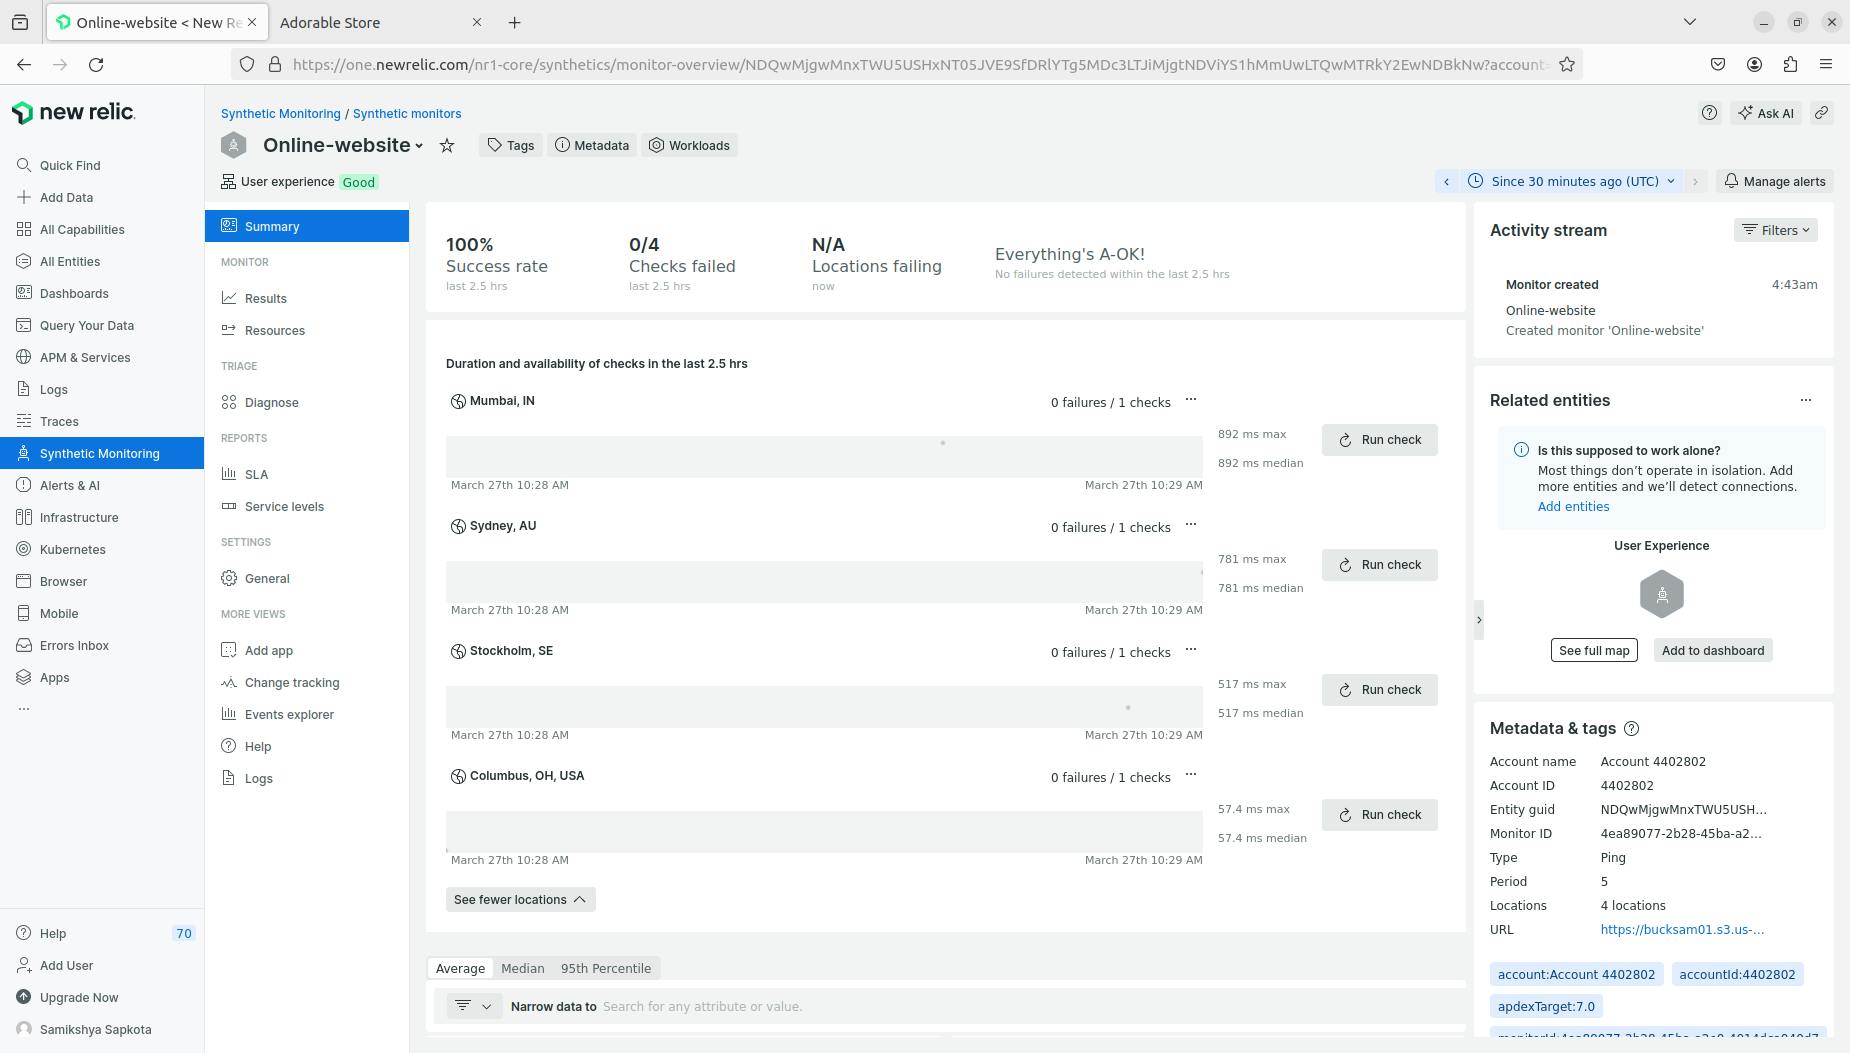
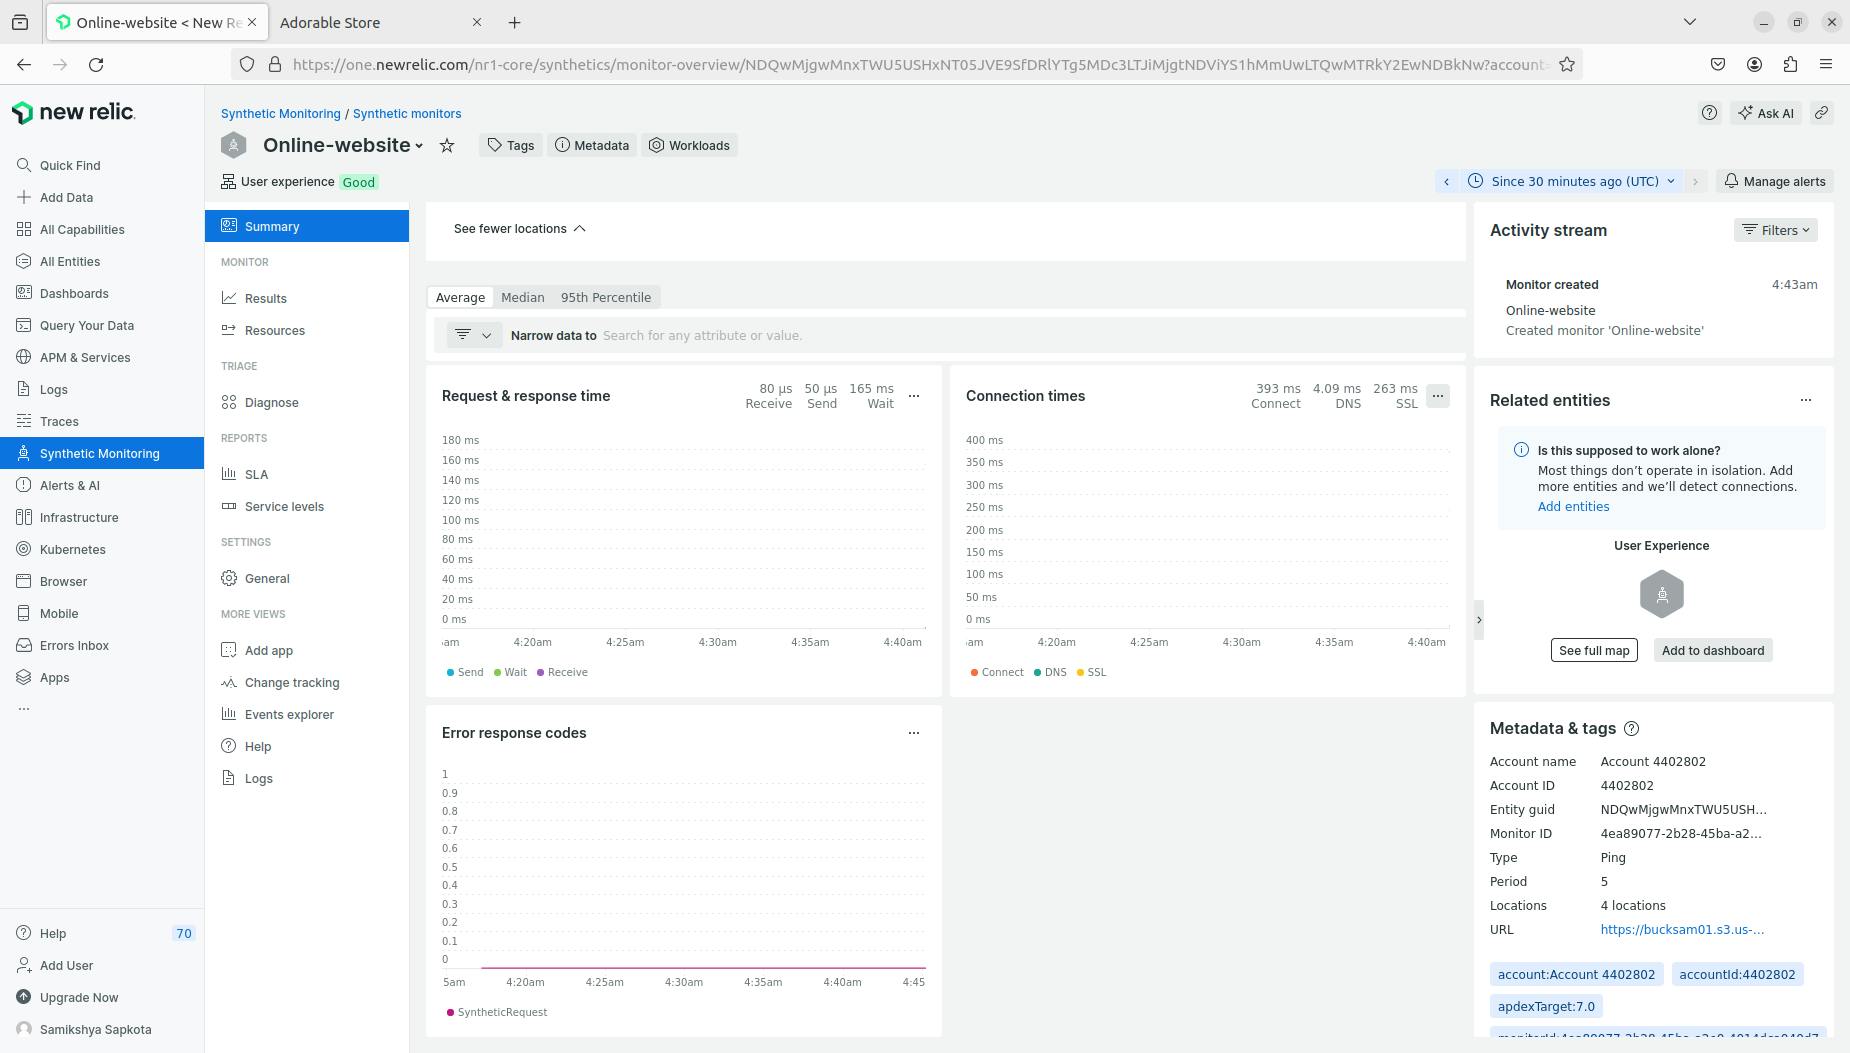
- After saving the monitor, you will see the below page. Please wait for a few minutes for it to load with data.

- Reload the page after a couple of minutes to check the data and status of the monitoring.
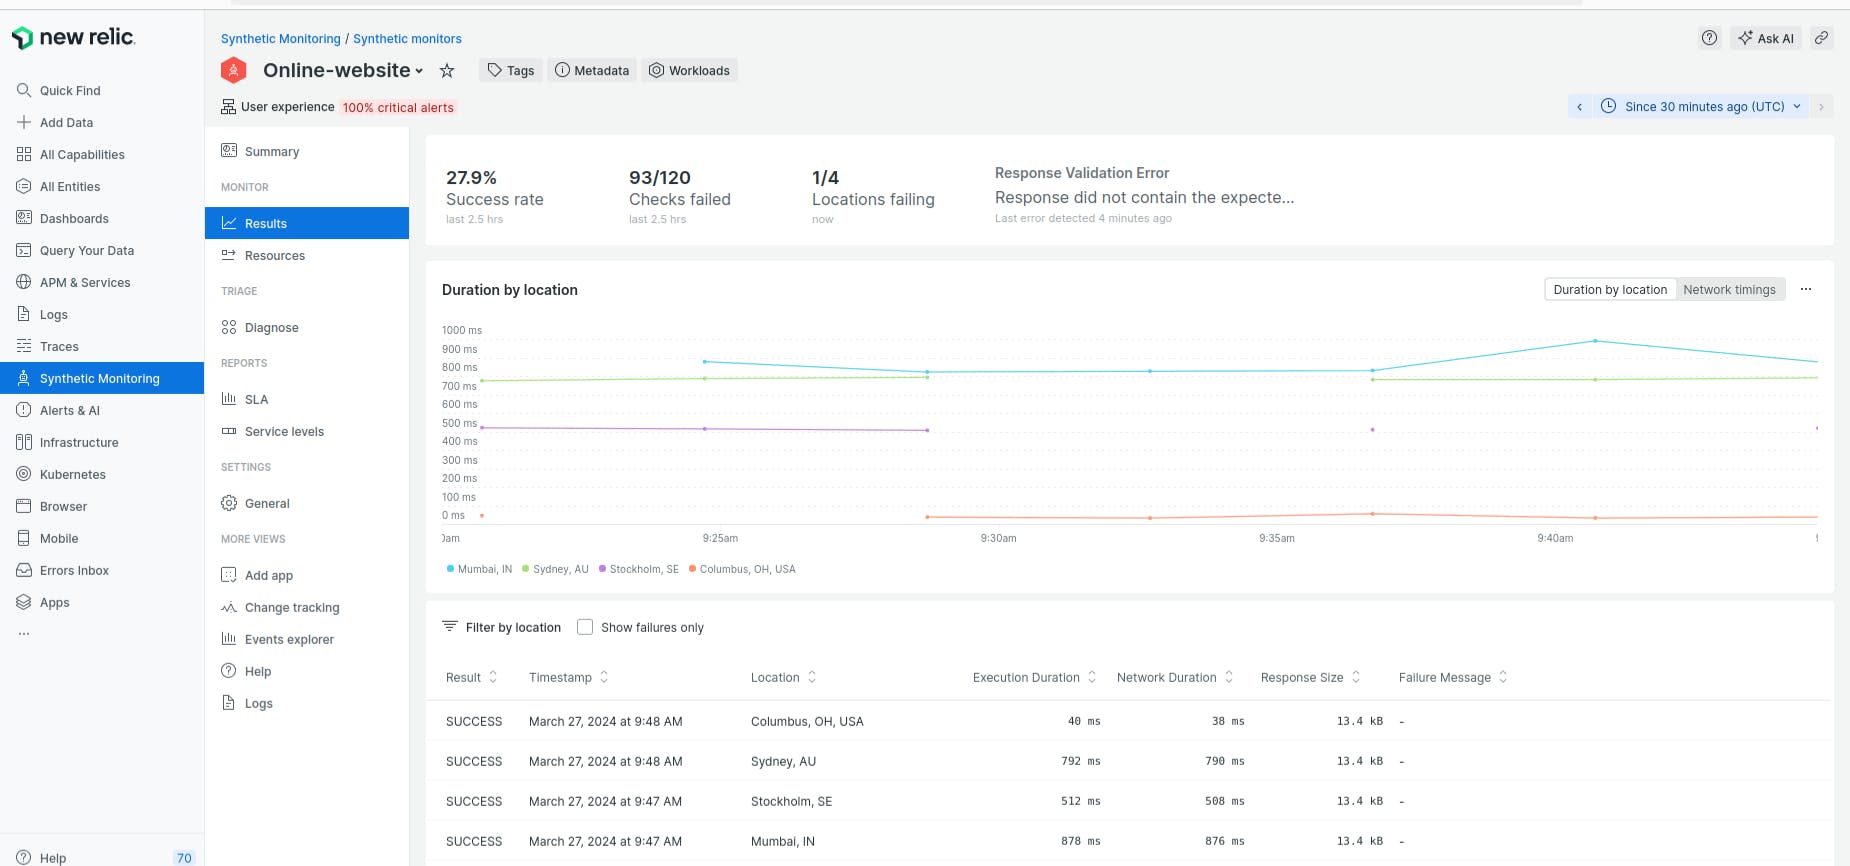
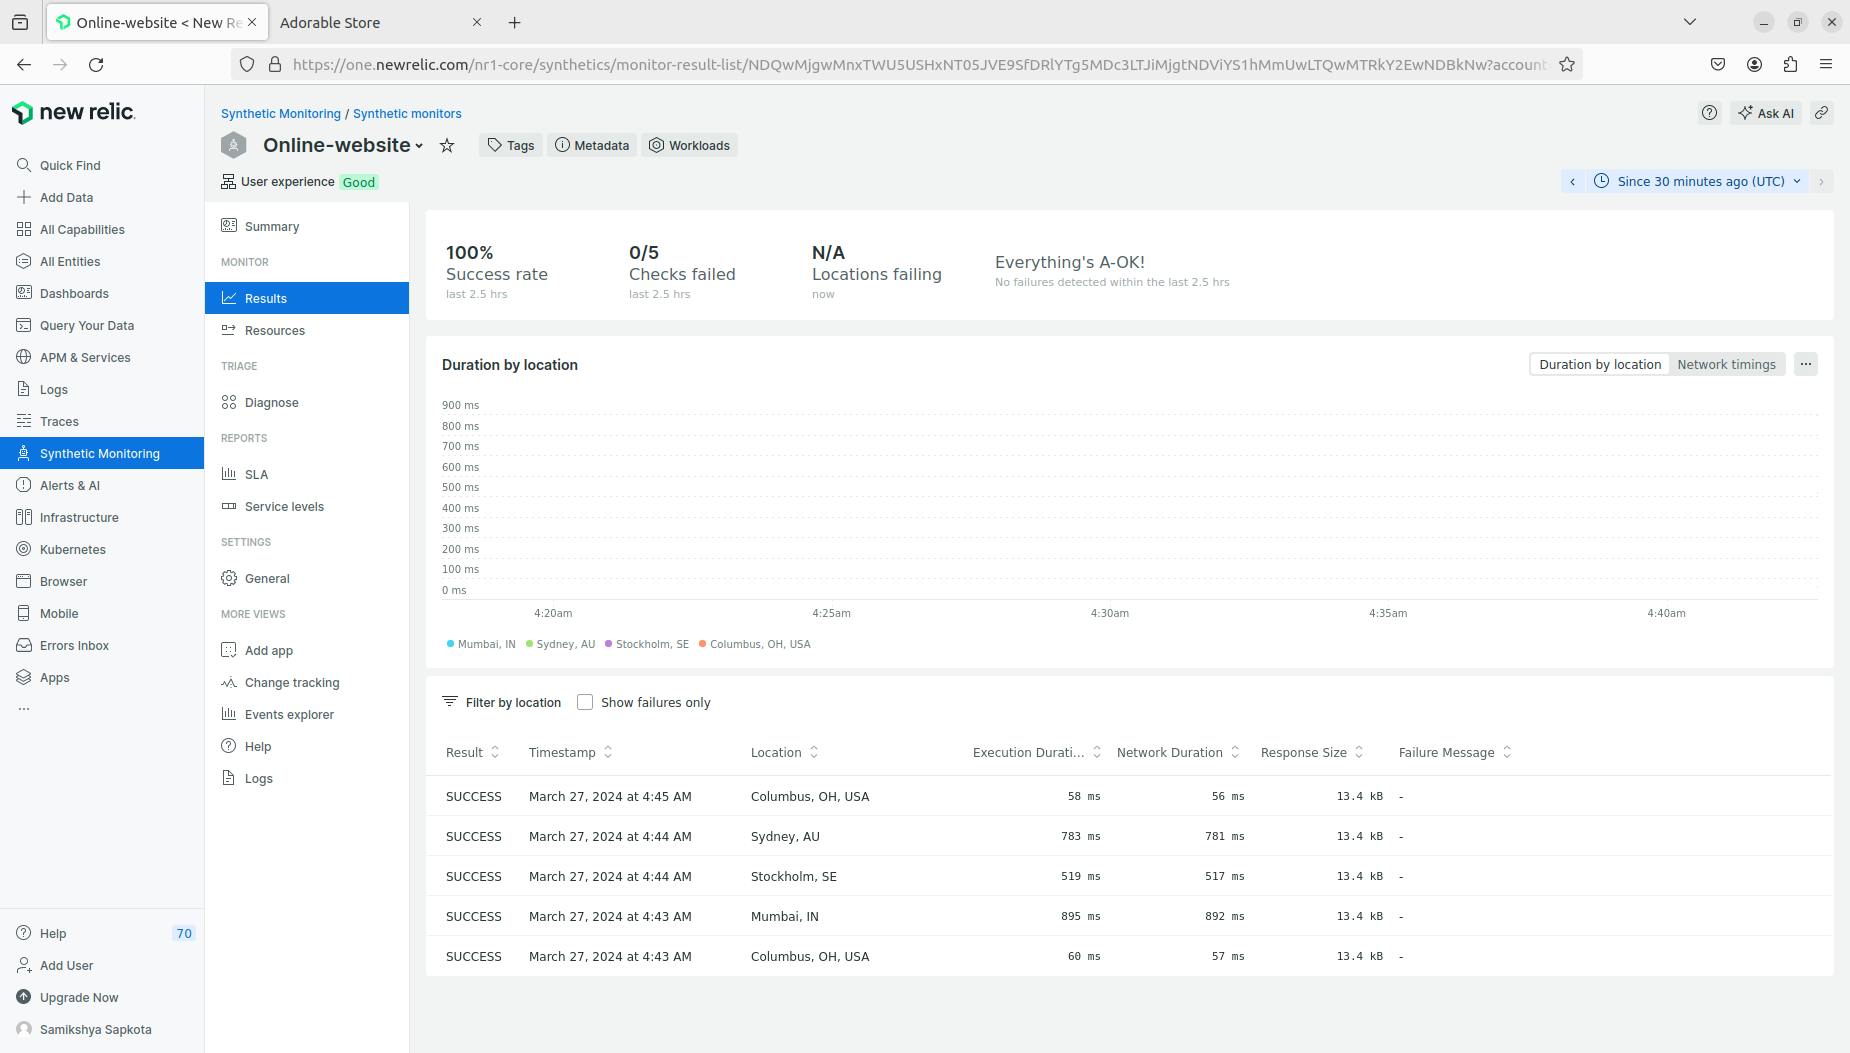
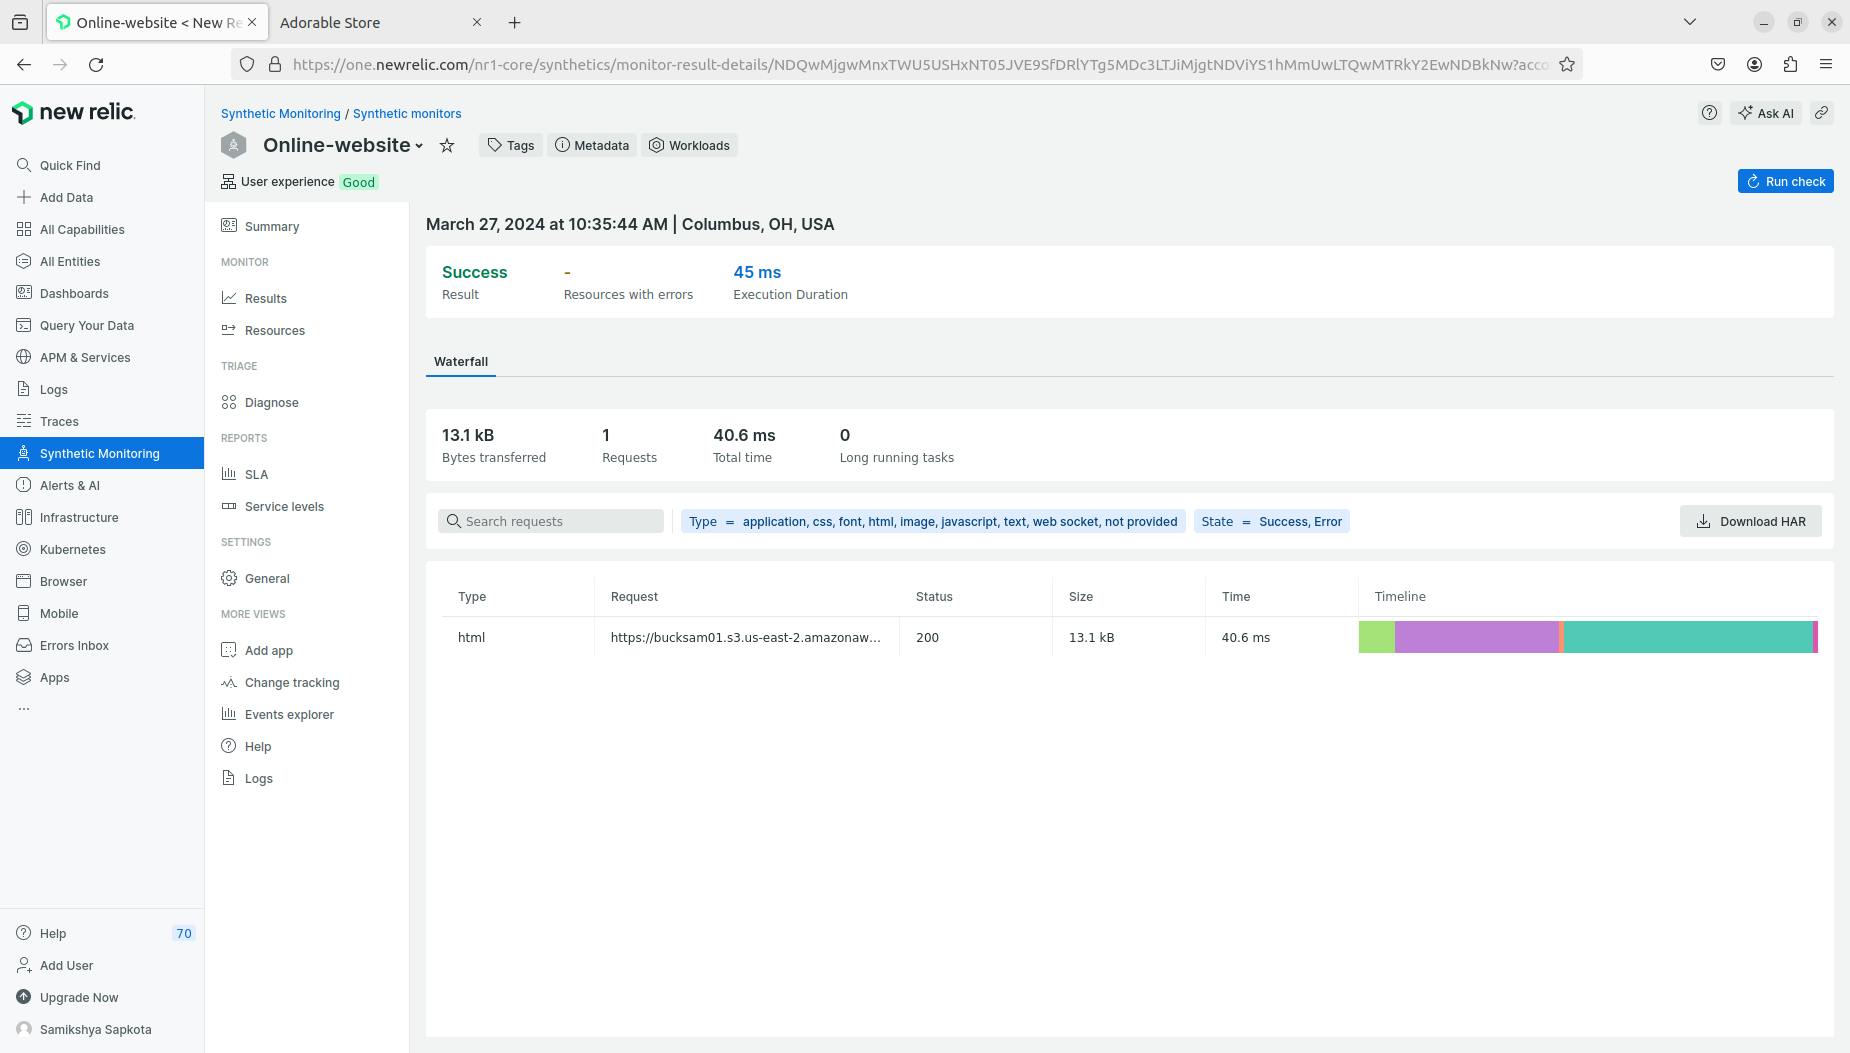
- You can also view the results of the monitor by selecting Results.
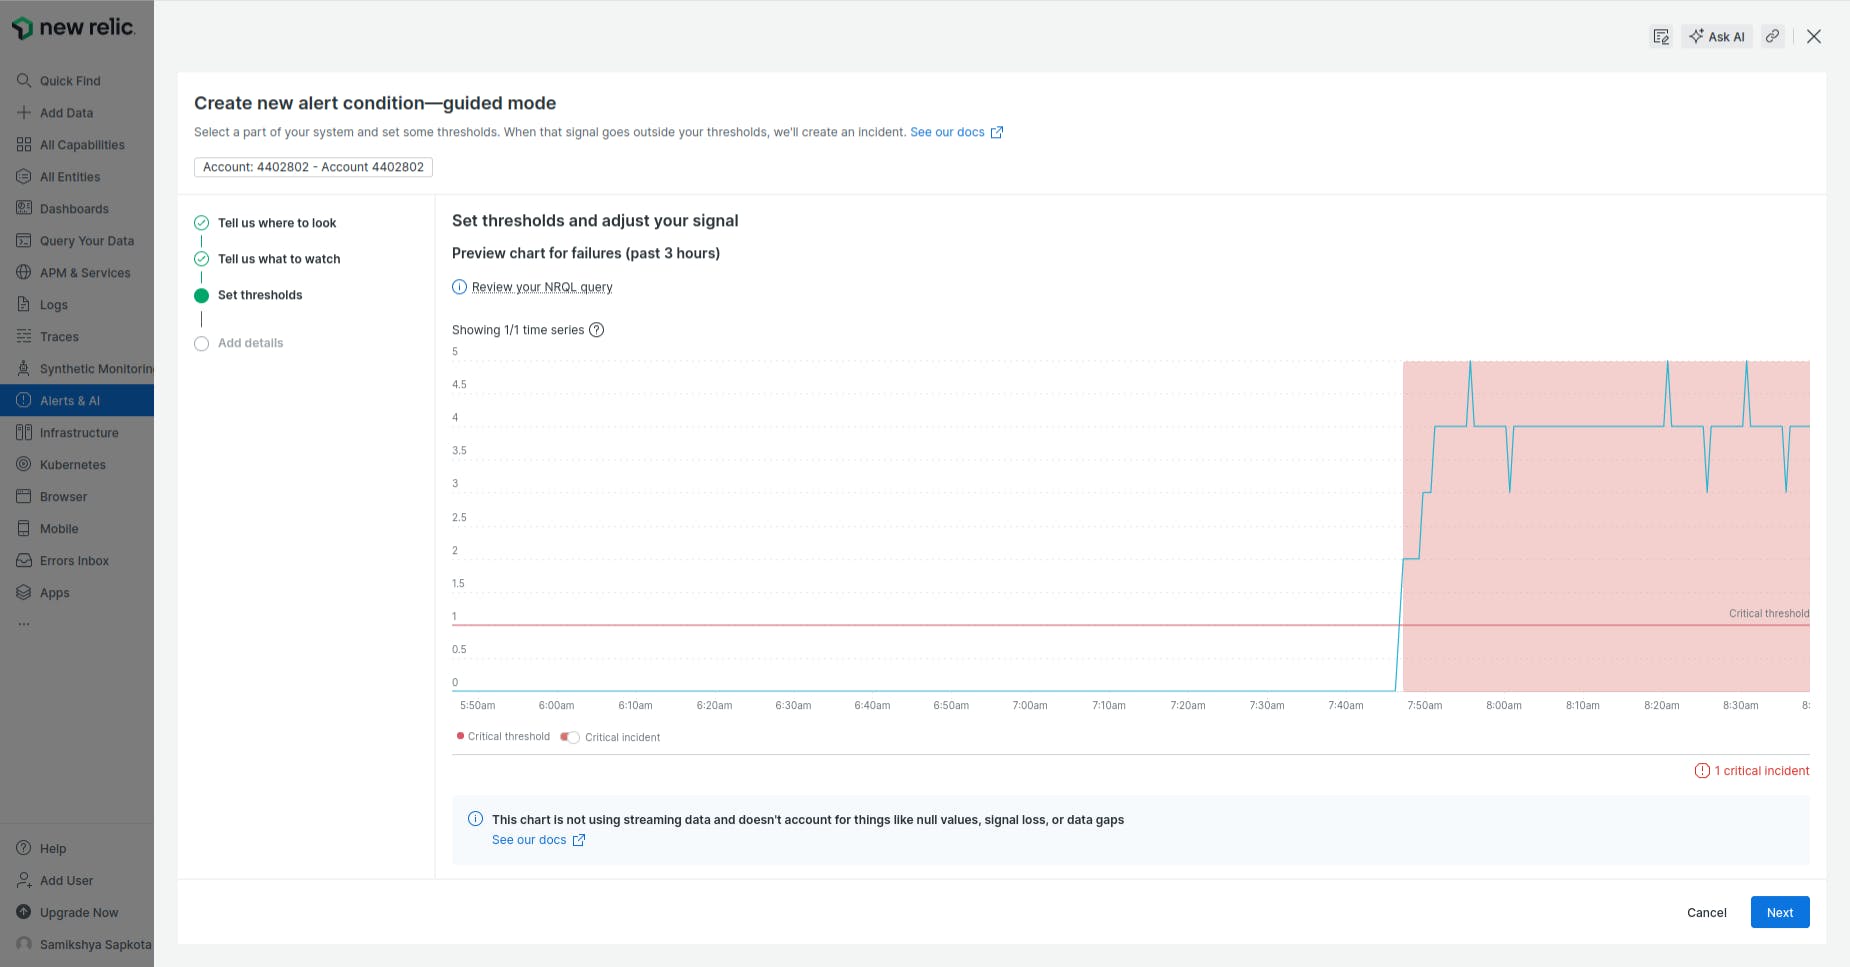
Till now, we saw how to create a monitor for a website. Now, we'll setup some kind of alert that basically notifies the respective team in case of a failure.
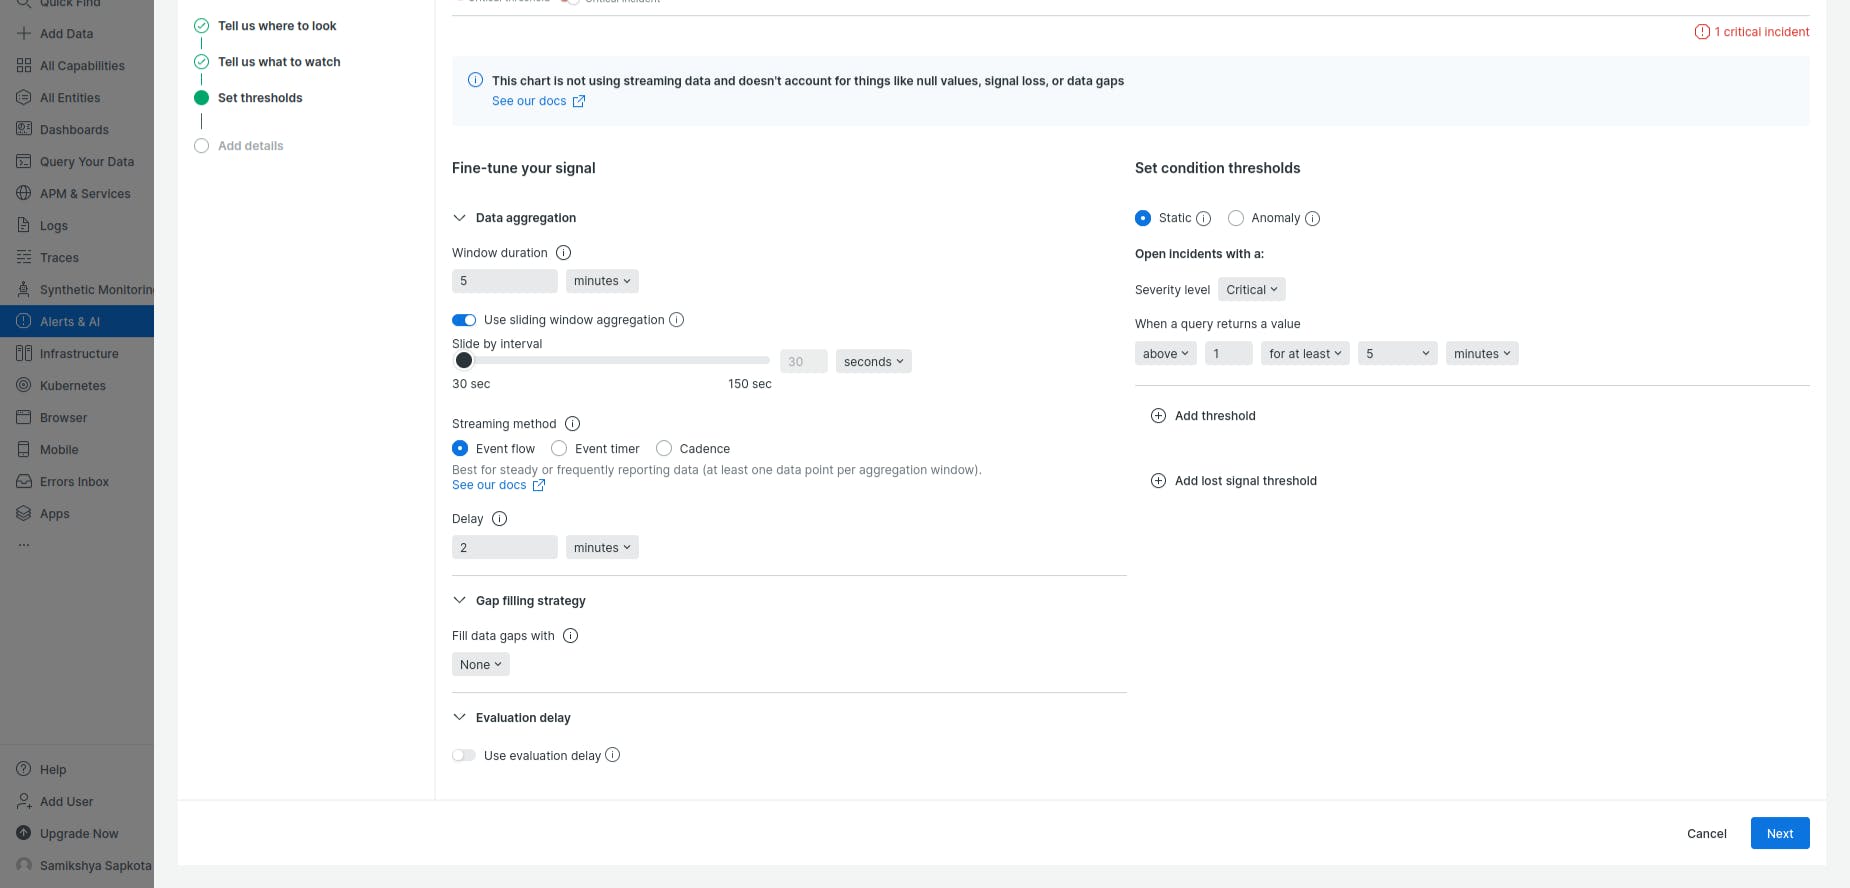
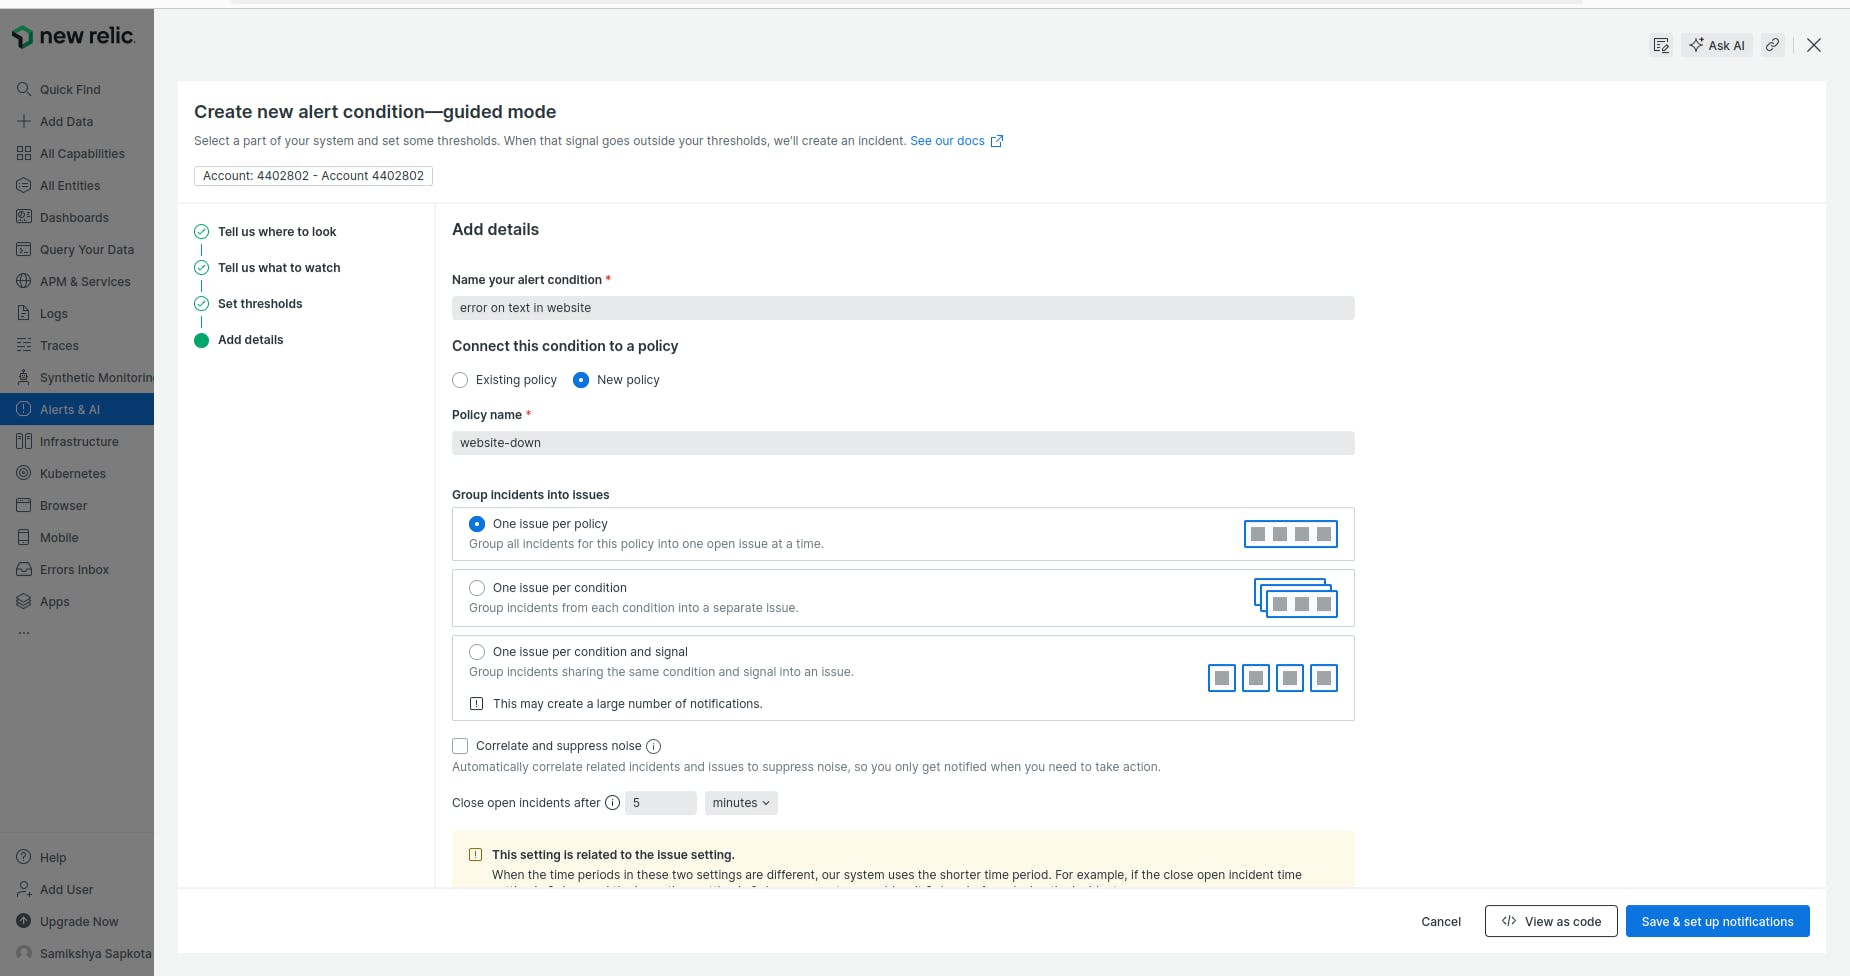
Step2 :- Creating an alert
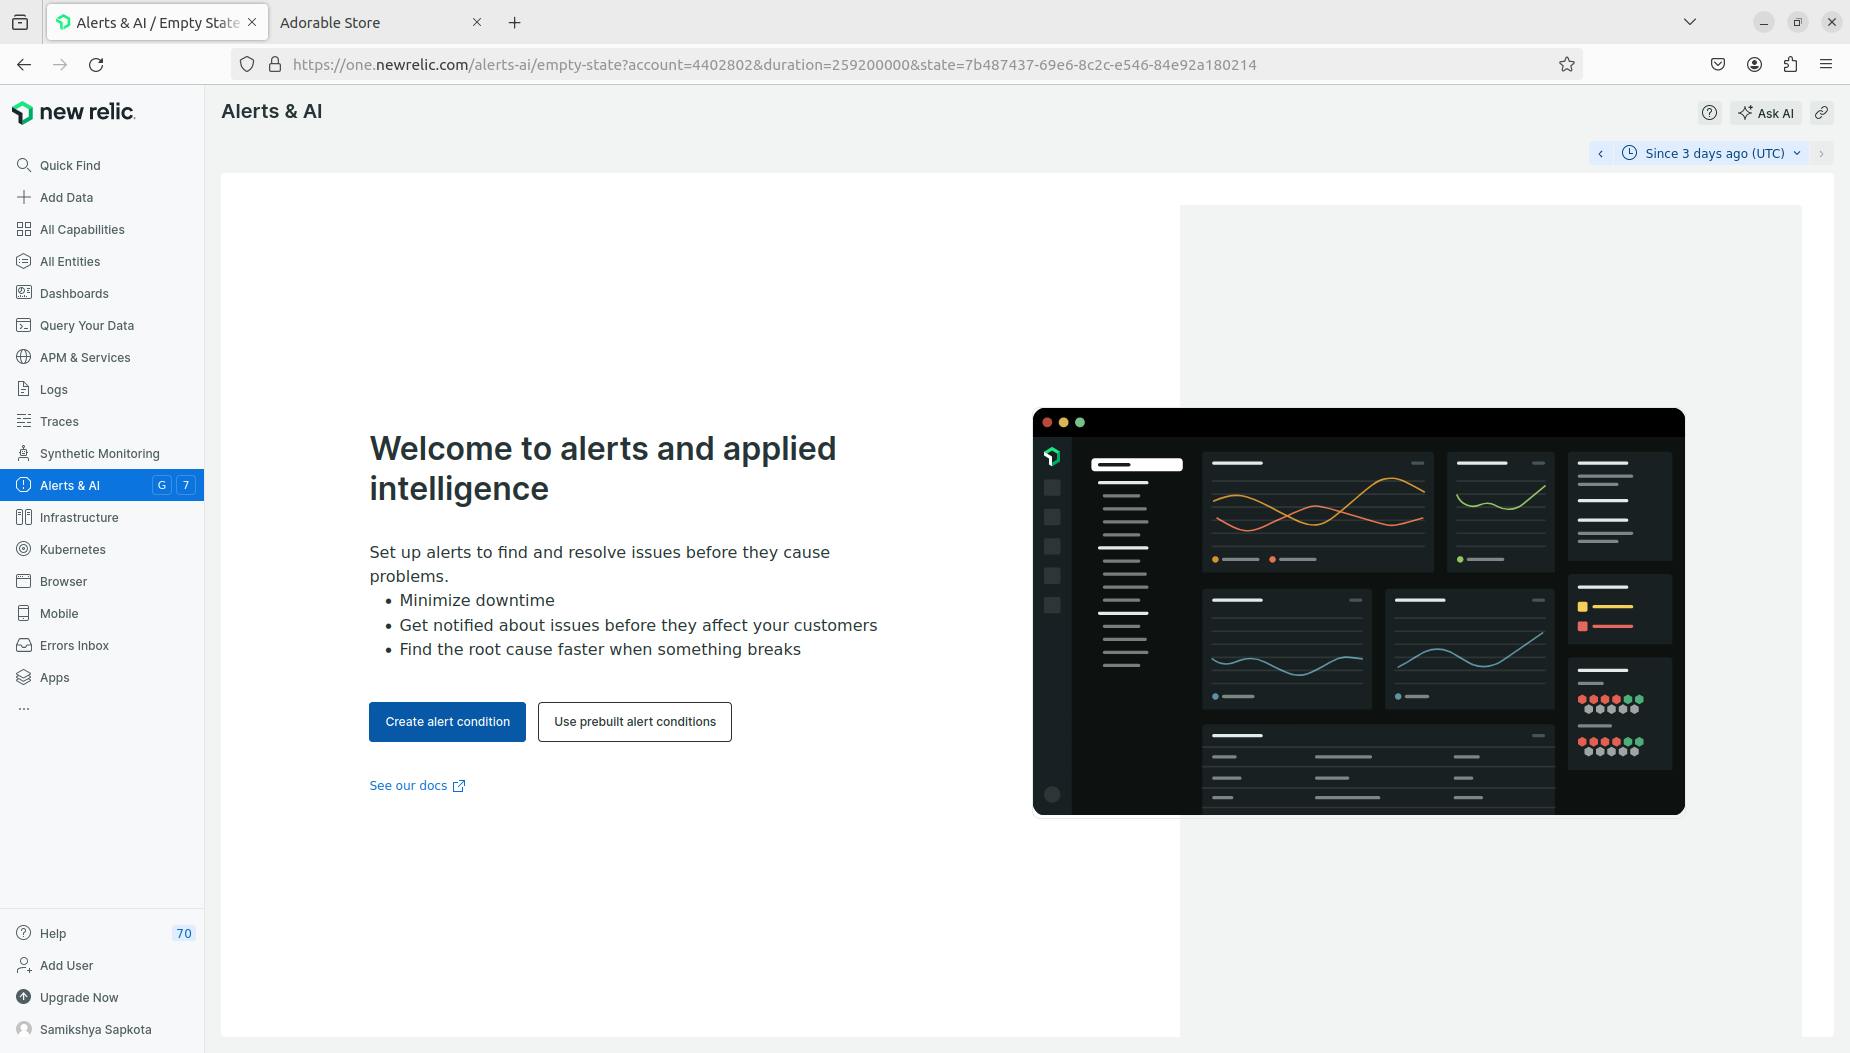
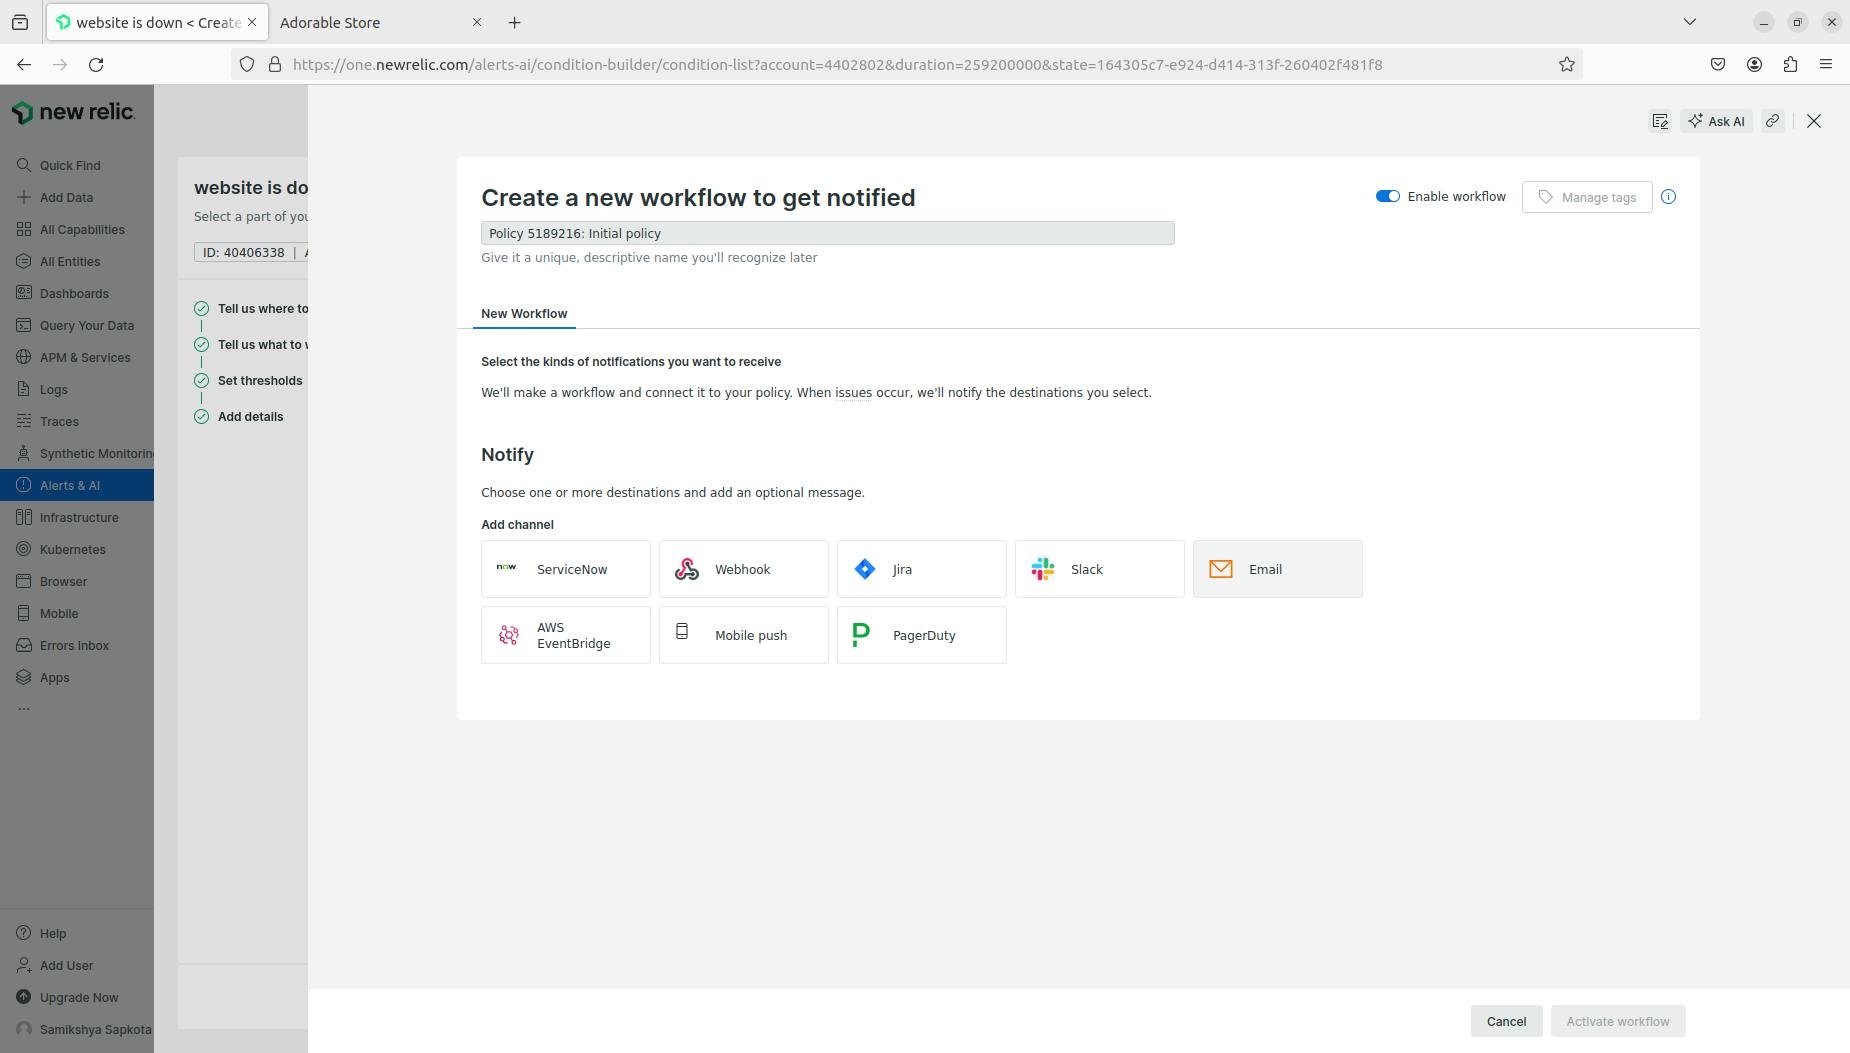
- To set up an alert, we are going to utilize Alerts & AI capability of New Relic. On the left side panel.


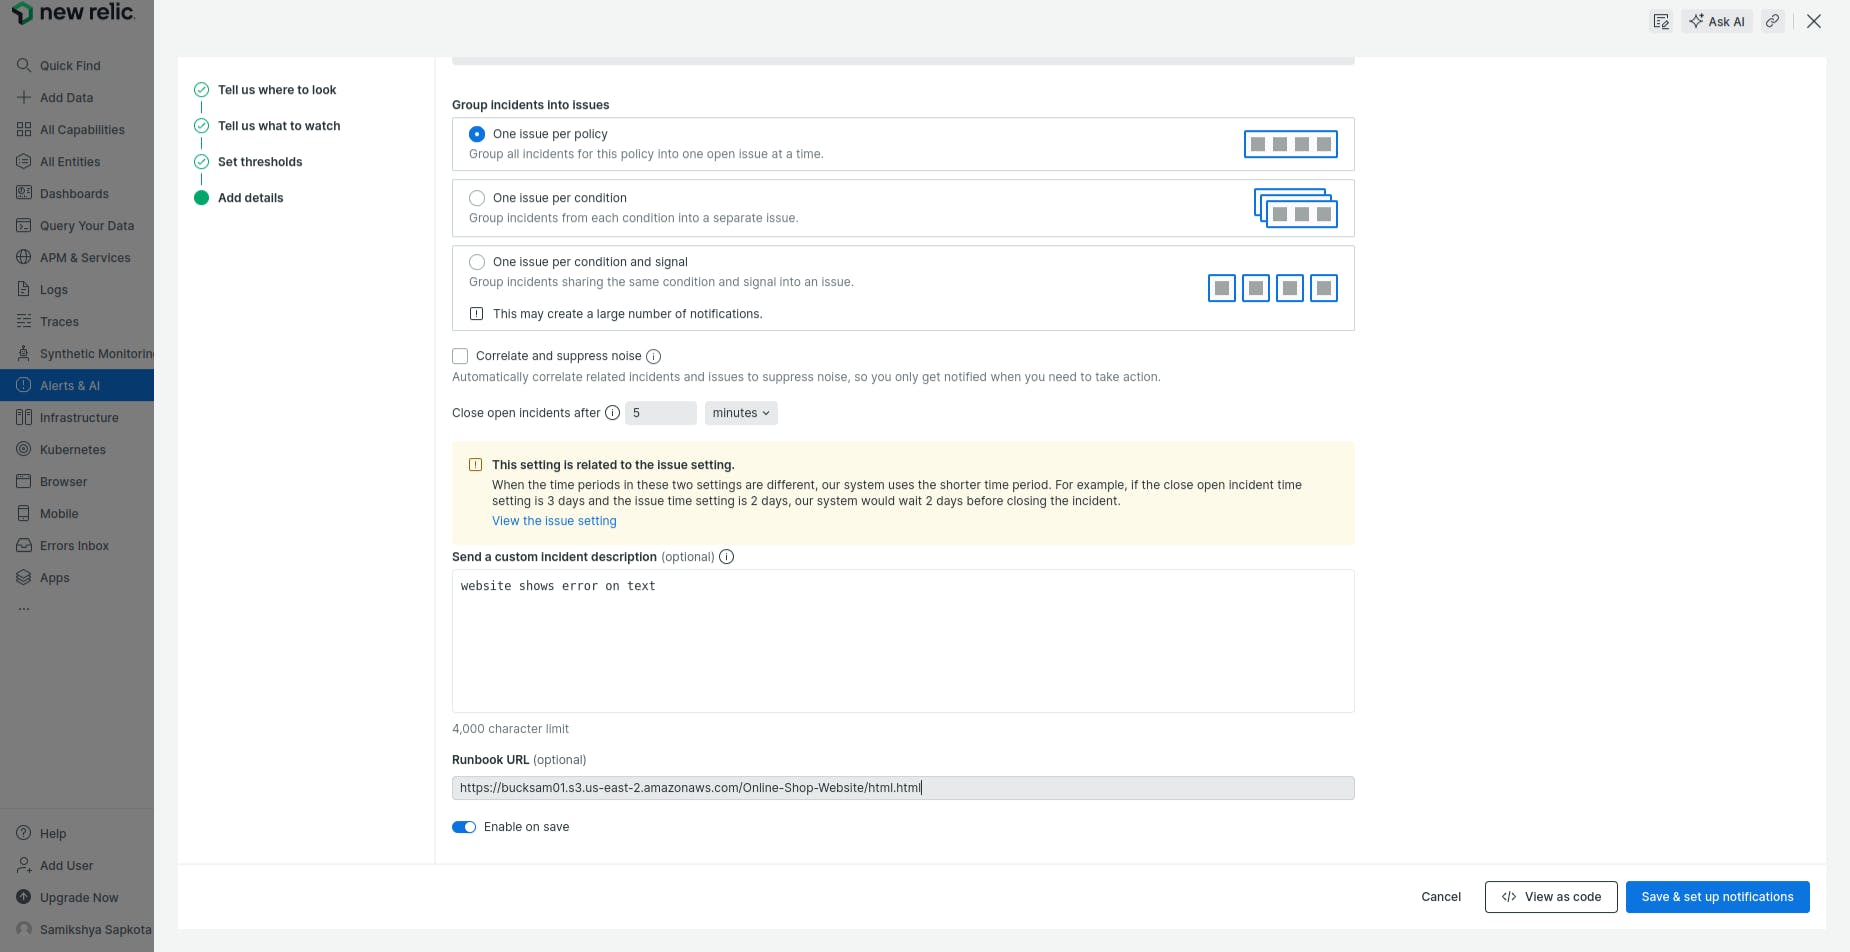
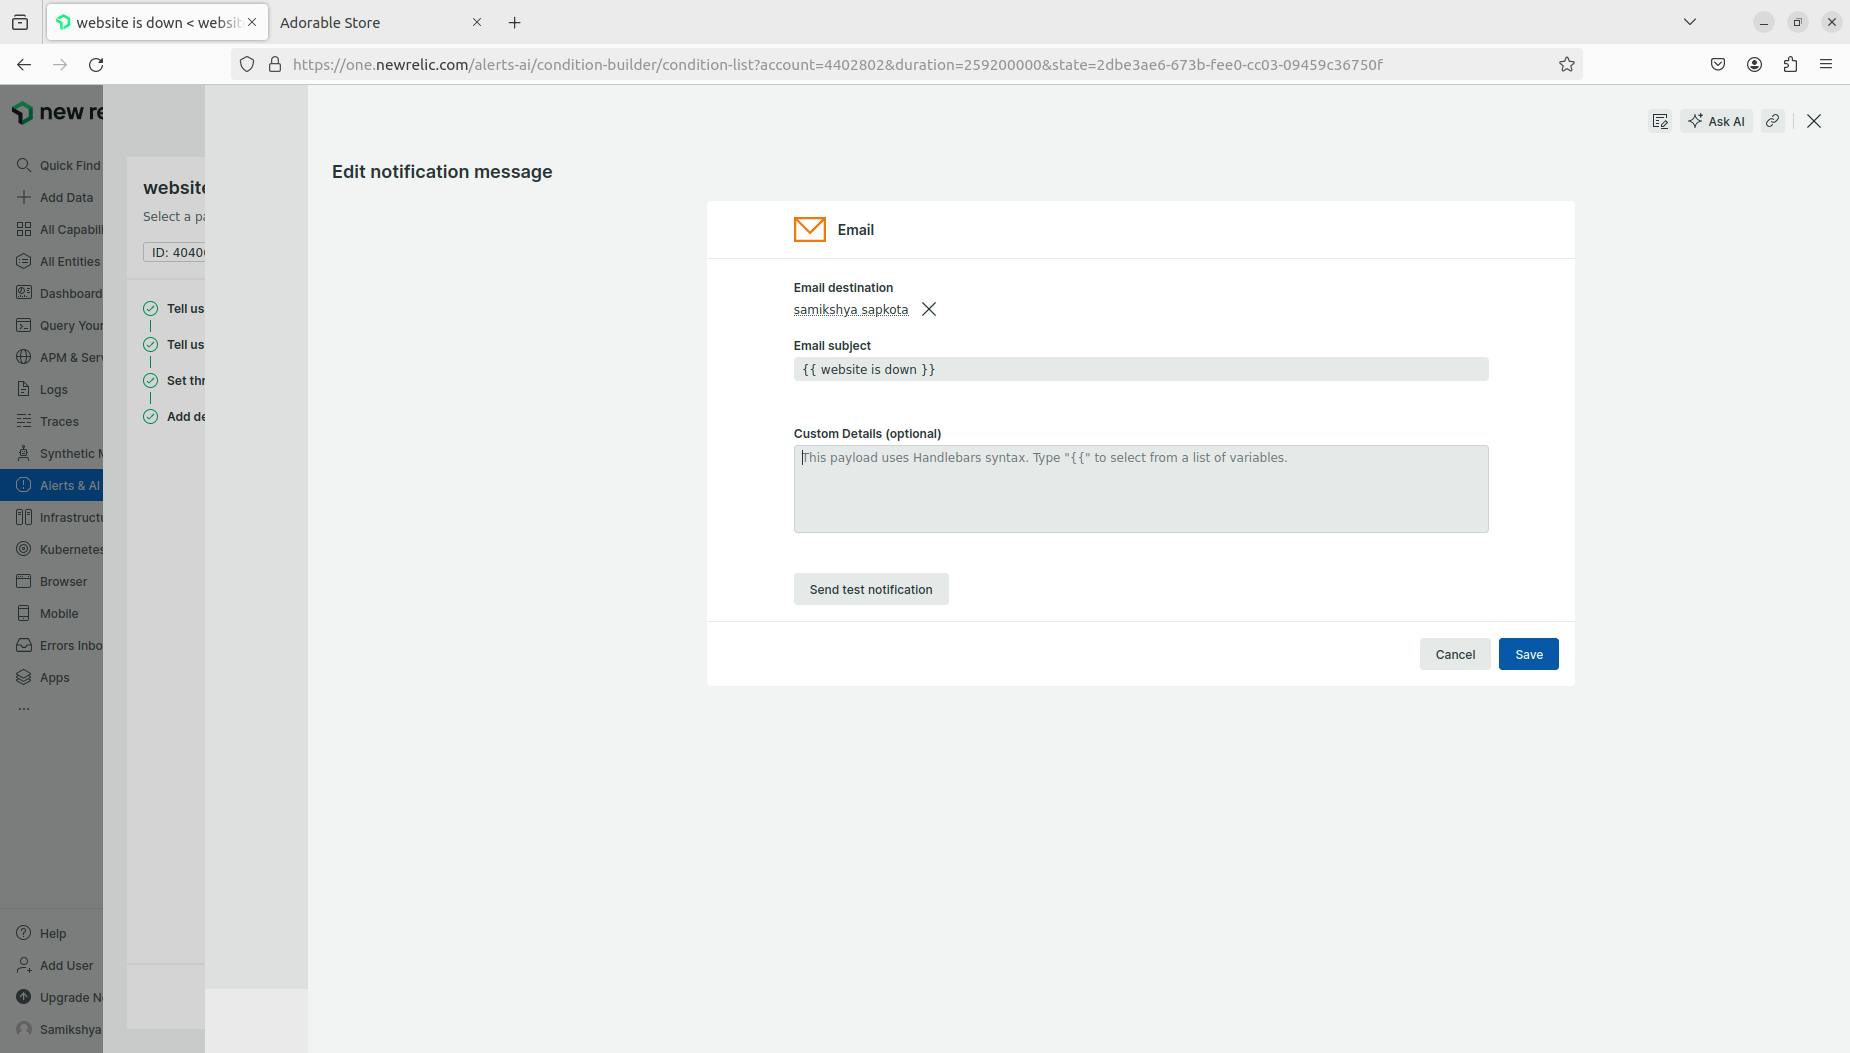
- Select the type of notification you want - email,slack etc.. I am selecting Email notification.
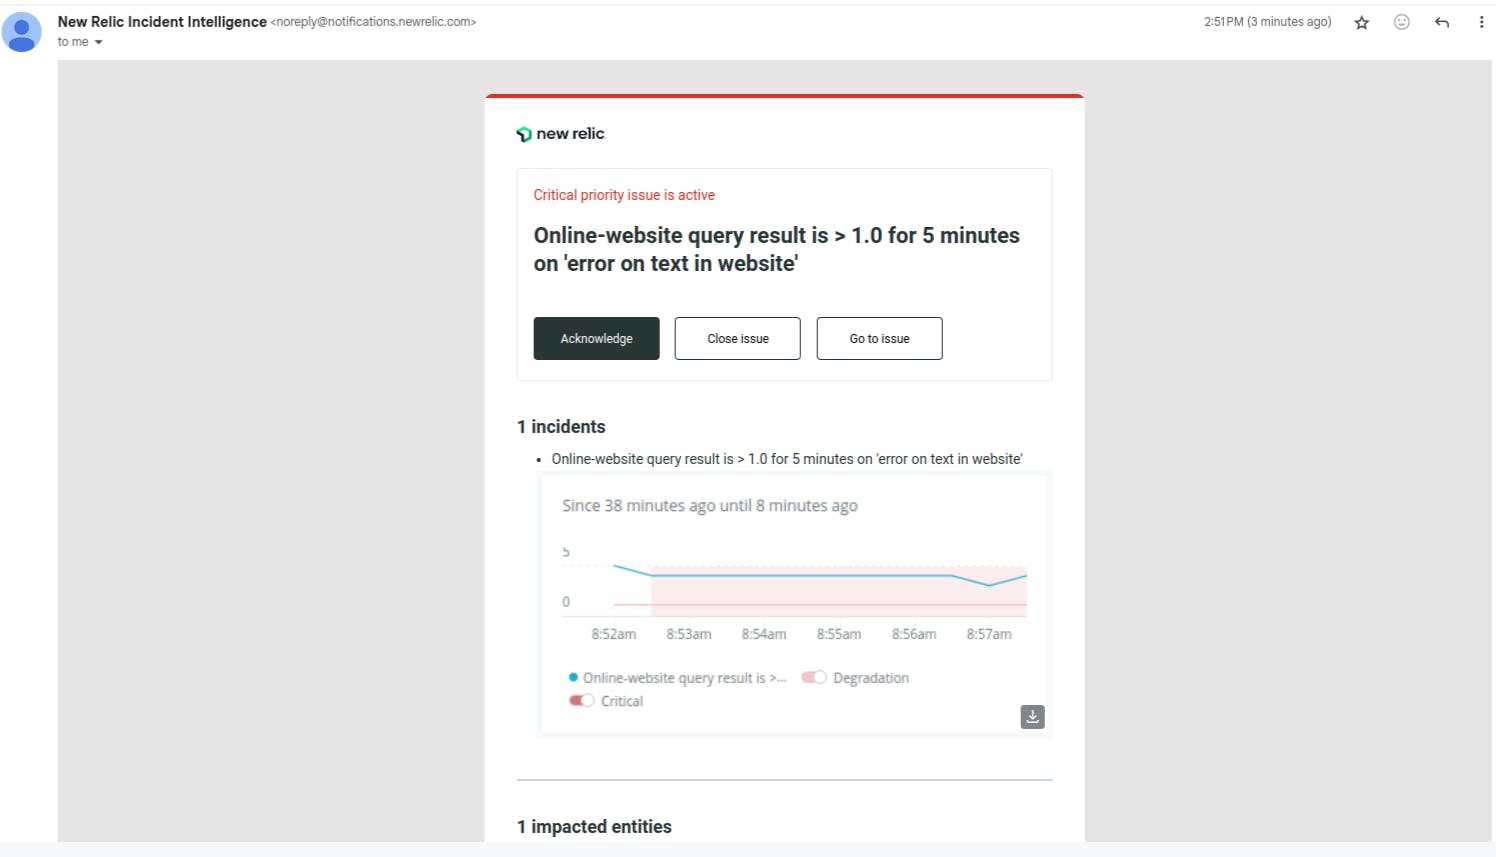
And, with this you are done! The alert will check the results of the monitor and in cases where it reaches the threshold, the alert will send notification via email. Email notification looks like:
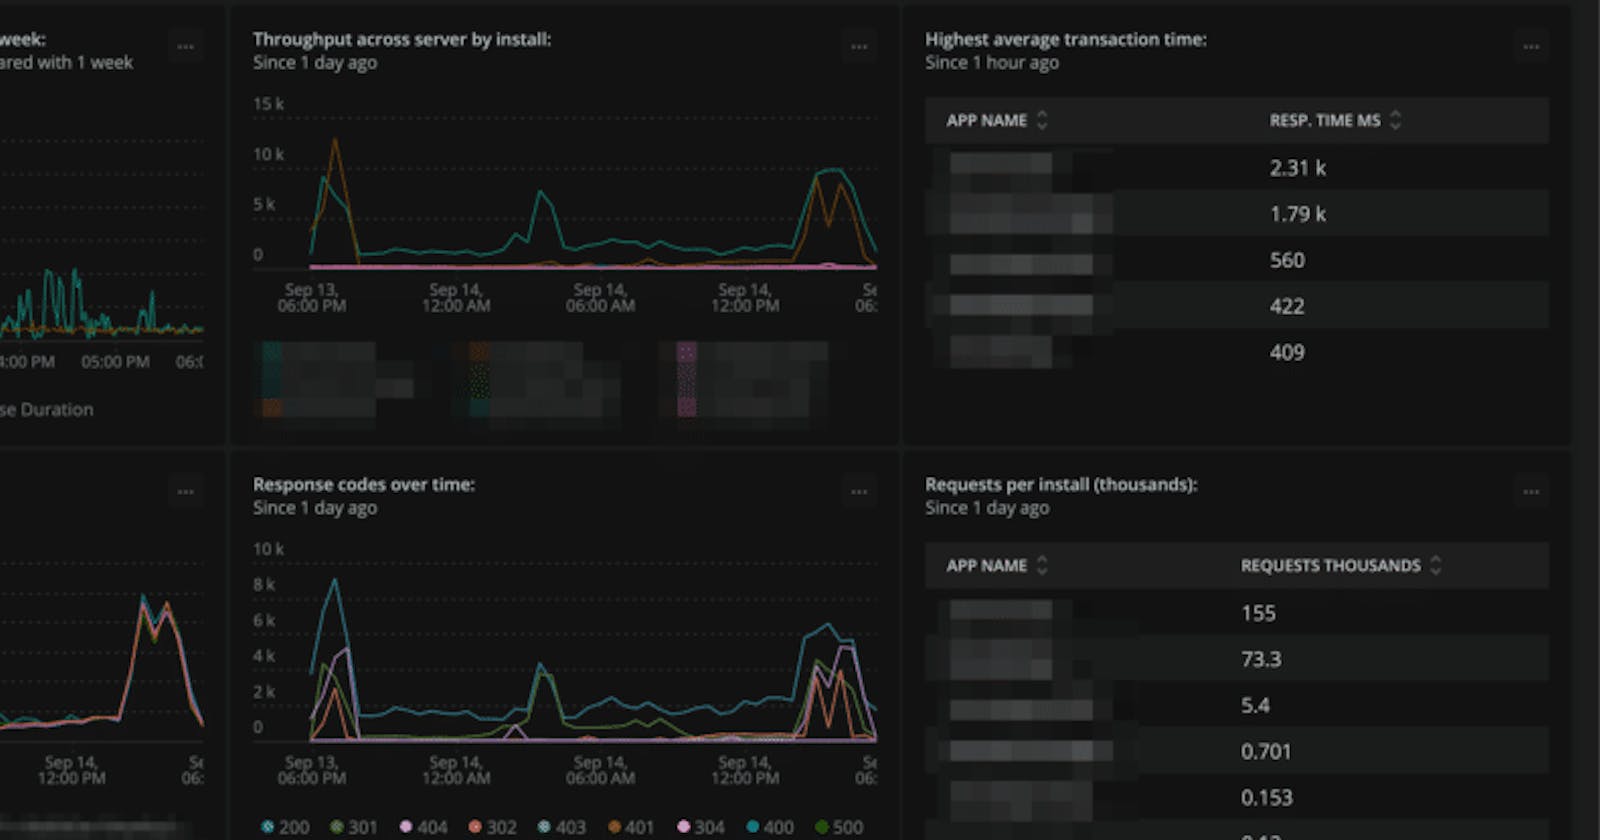
The New Relic dashboard will show the incidents that have been created and closed after fixing.